Monday, July 15, 2013

Reflection through Y axis

%reflection through y axis
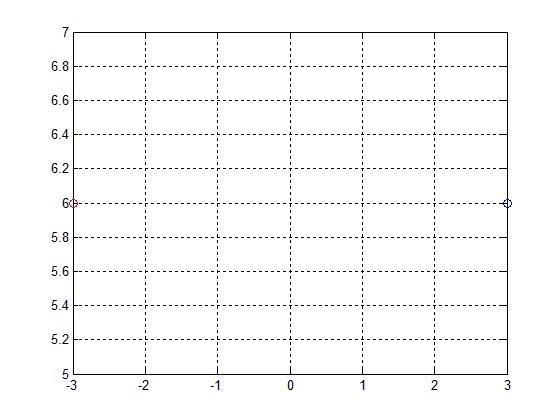
point=[3 6];
a=-1; %negative
d=1;
b=0;
c=0;
%if a and/or d are negative reflections through an axis or plane occur
T=[a b;c d];

transformed_point=point*T;
plot(point(1),point(2),'ob');%origin is plotted in blue circle
hold on
plot(transformed_point(1),transformed_point(2),'or');%point 1 is plotted in red circle
grid on 


(a)Reflection about y axis ; blue dot is the original point;red dot is the original point


Transformation of points

%transformation of points
%consider the effect of multiplying an arbitrary point(1x2) with a (2x2) transformation matrix

syms x y
syms a b c d
point=[x y];%(1x2)point
T=[a b;c d];%(2x2) transformation matrix
%%
transformed_point=point*T %transformed coordinates
%result:the transformed coordinates come out to be transformed_point=[ x*a+y*c, x*b+y*d]
%%
%case 1 a=d=1, b=c=0:identity transformation
a=1;
d=1;
b=0;
c=0;
 T=[a b;c d];
transformed_point=point*T %transformed coordinates
%transformed_point =[ x, y]

%%
%case 2 d=1, b=c=0:scaling the x coordinate
syms a
d=1;
b=0;
c=0;

 T=[a b;c d];
transformed_point=point*T %transformed coordinates

%result transformed_point =[ x*a,   y]

%%
%case 3 a=1 b=c=0:scaling the y coordinate

syms d
a=1;
b=0;
c=0;
 T=[a b;c d];

transformed_point=point*T %transformed coordinates

%result transformed_point =[   x, y*d]

%%
%case 4 b=c=0:scaling both x and y coordinates

syms a d
b=0;
c=0;
 T=[a b;c d];

transformed_point=point*T %transformed coordinates

%result transformed_point =[ x*a, y*d]


(a) Scaling along X axis with a scaling factor of 2 ; original point in blue color;transformed point in red color

(b)Scaling along Y axis with a scaling factor of 2 ; original point in blue color;transformed point in red color
 (c)Scaling along X and Y axes,each with a scaling factor of 2 ; original point in blue color;transformed point in red color

First Computer Program for visualising the points

%in this m-file we are taking row vectors as points in 2-d space
%let us first visualise the points.
%a point in 2d space is represented with x and y coordinates as [x y] with
%respect to some arbitrary origin

origin =[0 0];%this is the origin
point1 =[2 3];% this is one arbitrary point
point2= [8 -5];%this is the second arbitrary point

plot(origin (1),origin (2),'ob');%origin is plotted in blue circle
hold on
plot(point1 (1),point1 (2),'or');%point 1 is plotted in red circle
hold on
plot(point2(1),point2 (2),'og');%point 2 is placed in green circle
grid on


Now we have written our first matlab code for getting the points in our 2 d space.

Computer Graphics